
I’ve used a number of log viewers in command terminal, on MacOS and Linux server. I read system logs, log4j formats, as well as json formats. Unfortunately, I have not found an ideal (free) log viewer, either on UI or in command terminal.
Out of those I tried lnav is one of the better ones. It’s been around for more than 10 years and is configurable for a variety of formats. It is available in EPEL-repository for Linux and home brew for Mac.
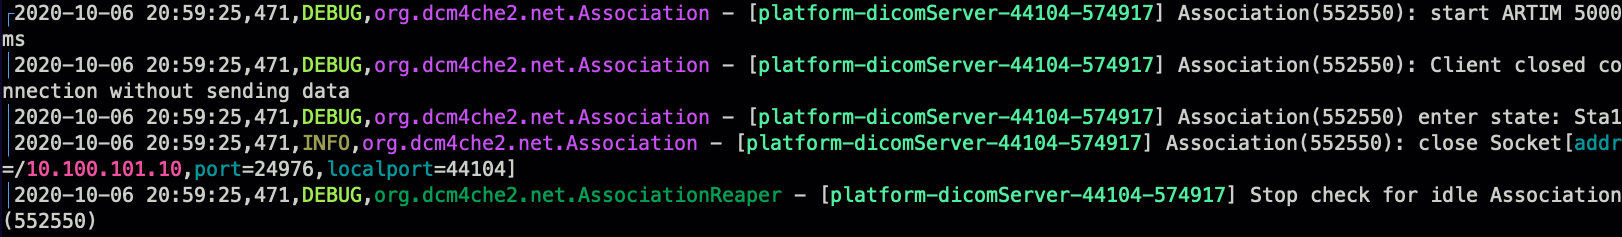
For example, if our log (produced by log4j) looks like this:
2020-10-06 20:59:25,471,DEBUG,org.dcm4che2.net.Association - [platform-dicomServer-44104-574917] Association(552550): start ARTIM 5000ms
2020-10-06 20:59:25,471,DEBUG,org.dcm4che2.net.Association - [platform-dicomServer-44104-574917] Association(552550): Client closed connecti
on without sending data
2020-10-06 20:59:25,471,DEBUG,org.dcm4che2.net.Association - [platform-dicomServer-44104-574917] Association(552550) enter state: Sta1
2020-10-06 20:59:25,471,INFO,org.dcm4che2.net.Association - [platform-dicomServer-44104-574917] Association(552550): close Socket[addr=/10.100.101.10,port=24976,localport=44104]
2020-10-06 20:59:25,471,DEBUG,org.dcm4che2.net.AssociationReaper - [platform-dicomServer-44104-574917] Stop check for idle Association(552550)
We can introduce custom formatting, for example:
{
  "dapp" : {
    "title" : "dapp log4j format",
    "description" : "dapp log4j format",
    "regex" : {
      "dapp" : {
         "pattern": "^(?<timestamp>\\d{4}-\\d{2}-\\d{2} \\d{2}:\\d{2}:\\d{2},\\d{3}),(?<level>\\w+),(?<component>[\\w-.]+) - \\[(?<thread>[^ ]+)\\] (?<body>.*)$"
       }
    },
    "level-field" : "level",
    "level" : {
      "error" : "ERROR",
      "warning" : "WARN",
      "info" : "INFO",
      "debug" : "DEBUG"
    },
    "value" : {
      "level" : { "kind" : "string", "identifier" : true },
      "component" : { "kind" : "string", "identifier" : true },
      "thread" : { "kind" : "string", "identifier" : true },
      "body" : { "kind" : "string" }
    },
    "highlights" : {
      "DIMSE" : {
        "pattern" : "A-(ASSOCIATE-(RQ|AC)|RELEASE-(RQ|RP)|ABORT)|C-(STORE|MOVE|FIND|ECHO)-(RQ|RSP)",
        "color" : "Red"
      }
    },
    "sample" : [
      {
         "line" : "2020-10-06 12:00:28,500,INFO,dicom.dicom-main - [main] Start listening on port 44104"
      }
    ]
  }
}
Save the content above as ~/.lnav/formats/installed/dapp.json, then load the log file with lnav, lnav will display the log by presenting columns in different colours.
One of the default behaviours is highlighting the IPv4 address, as shown above. This behaviour is however, not optional and currently cannot be turned off, which is reported here.