There are too many metrics that describes some aspects about memory in Linux. This posting will make sense of those common metrics in Linux, CentOS as an example.
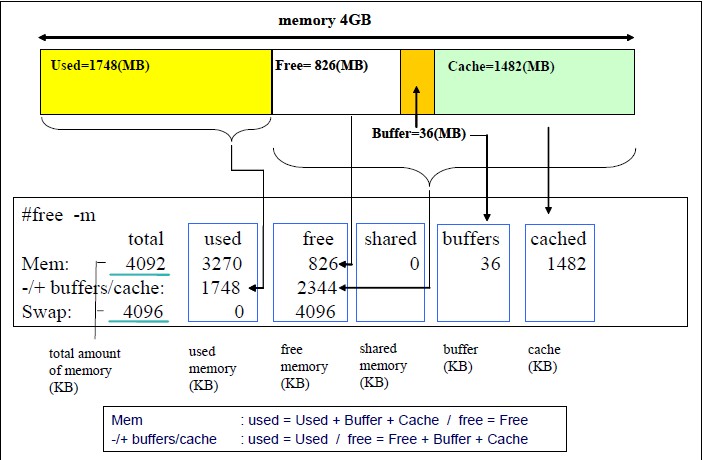
The most fundamental command is free and my favourite switch is -h for human readable reads. You can use -m, -k, -b for different units. The result looks like this:
              total        used        free      shared  buff/cache   available
Mem:       32780168    16832160     3200408      101356    12747600    15399528
Swap:       2097148     2055148       42000
Swap is essentially disk space and many application such as Cassandra, ElasticSearch recommend disabling swap as best practice and they do not want disk speed to drag the performance of memory. Many suggest that swap is not needed in today’s era at all given the amount of memory for cheap. This is debatable.
With the row for Mem, the four columns should add up to the total, as suggested in the chart below.

total = free + used + shared + buff/cache
The four columns from free command output are supposed to always add up to the physical memory size. This command simplifies things quite a bit and each of these values are actually taken from certain lines in /proc/meminfo:
| Metric from free command | Metric in /proc/meminfo |
| total | MemTotal |
| used | ?? |
| free | MemFree |
| shared | Shmem |
| buff/cache | Cached + Slab |
| available | MemAvailable |
The buffer and cache (and even swap) can be freed by command. The value of used doesn’t seem to come from anwhere in /proc/meminfo, but it should be calculable from the memory used per process, which can be seen from top command.
In the result of top command, the column RSS (resident set size) is from the VmRSS value in /proc/<pid>/status, it is the actual physical memory consumed by the process. This value is originally from the second read in /proc/<pid>/statm, which represents the number of pages. For example:
[ghunch@centos ~]$ cat /proc/6495/status | grep VmRSS ; cat /proc/6495/statm
VmRSS:	20852916 kB
49829626 5213229 1212275 1 0 5773980 0
[ghunch@centos ~]$ getconf PAGE_SIZE
4096
Linux default page size is 4096 or 4K, so in the result from above, 5213229 x 4kB = 20852916 kB, which is the size of memory taken by process ID 6459. Therefore if we go through all processes and add up the VmRSS, we should get (close to) the used memory?
But wait a second, we have not account for slab info (memory used by kernel) yet, which is displayed in /proc/slabinfo. To calculate the total size taken by slab, we use <num_objs> and <objsize> columns from /proc/slabinfo.
Apart from that there is page table, the table that stores the mapping between virtual address and physical address, is stored in the physical memory as well and the size is specified in the PageTables entry in /proc/meminfo.
Now our equation becomes:
Used Memory = (RSS for all processes) + (all objects in slab) + (page table)
We can use the following script to calculate the used memory and compare it with free command output.
#/bin/bash
for PROC in `ls /proc/|grep "^[0-9]"`
do
  if [ -f /proc/$PROC/statm ]; then
      TEP=`cat /proc/$PROC/statm | awk '{print ($2)}'`
      RSS=`expr $RSS + $TEP`
  fi
done
RSS=`expr $RSS \* 4`
PageTable=`grep PageTables /proc/meminfo | awk '{print $2}'`
SlabInfo=`cat /proc/slabinfo |awk 'BEGIN{sum=0;}{sum=sum+$3*$4;}END{print sum/1024/1024}'`

echo $RSS"KB", $PageTable"KB", $SlabInfo"MB"
printf "rss+pagetable+slabinfo=%sMB\n" `echo $RSS/1024 + $PageTable/1024 + $SlabInfo|bc`
free -m
Running it require root access and the bc package installed. The result is most likely greater than the used memory value. Below is the result from my server:
89925884KB, 201788KB, 3303.92MB
rss+pagetable+slabinfo=91318.92MB
              total        used        free      shared  buff/cache   available
Mem:         128772       87032         726         498       41013       40346
Swap:          2047           3        2044
So the result is over by (91318 – 87032) = 4286M. This is due to shared memory. The RSS value from above include memory from shared libraries as long as the pages from those libraries are in the memory. If multiple processes use the same library, the memory from shared library is counted multiple times. Check out the difference between RSS and PSS (proportional set size)
[Disclaimer] The chart and script are stolen from this authors post.
